
Election 2016 Project
Methodology
Results for the Gallup poll are based on telephone interviews conducted beginning on July 11, 2016, on the Gallup U.S. Daily survey, with a random sample of 500 adults, aged 18 and older, living in all 50 U.S. states and the District of Columbia. For results based on each weekly samples of approximately 3,500 national adults, the margin of sampling error is ±2 percentage points at the 95% confidence level. All reported margins of sampling error include computed design effects for weighting.
Each sample of national adults includes a minimum quota of 60% cellphone respondents and 40% landline respondents, with additional minimum quotas by time zone within region. Landline and cellular telephone numbers are selected using random-digit-dial methods.
Learn more about how the Gallup U.S. Daily works.
The members of this working group included Leticia Bode, Ceren Budak, Jonathan Ladd, Frank Newport, Josh Pasek, Lisa Singh, Stuart Soroka, and Michael Traugott.

What Americans have read or heard about Hillary Clinton
Topics
Survey responses and a random sample of tweets from the general public were coded to find what topics were being discussed for each candidate. Email, the Clinton Foundation, the FBI, and Wikileaks were frequent words connected to Clinton on Twitter. Negative words were less dominant in tweets about Trump.

What people said they had “read, seen or heard” about the candidates in 2016 as reported in our open-ended questions.

Tweets about the Candidates during the 2016 Campaign.
Stories
The figures below illustrate how the email story consistently dominated what people heard about Clinton, but no story similarly persisted for Trump.

What people said they had “read, seen or heard” about Trump throughout the election.

What people said they had “read, seen or heard” about Clinton throughout the election.
Attention to Events
Attention to major events was short-lived for both candidates. The figure to the right summarizes how long attention to major campaign events faded in the open-ended “read, seen or heard” questions. Data was averaged over all events.

Tone of Responses
The figure to the right shows the tone of the open-ended comments about Trump and Clinton on a positive-negative scale. Through most of the campaign, people mostly recalled hearing negative things about both candidates.

Fake News
Misinformation spread about both candidates throughout the campaign. The figure to the right shows the proportion of fake news on Twitter about both candidates from June through November.

Project Updates
Misinformation and the Impact of Social Media in Elections
Lisa Singh and Ceren Budak presented virtually for an event hosted by the McCourt school's Massive Data Institute and the Institute of Politics and Public Service (GU Politics) about the impact of misinformation in the 2016 election and what it could mean for the...
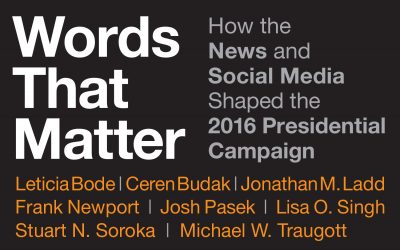
New Book: Words That Matter
What do voters really learn from the media about presidential candidates? A new book based on research from the S3MC Political Communication project, Words That Matter: How the News Media Environment Allowed Trump to Win the Presidency, offers in-depth analysis and...
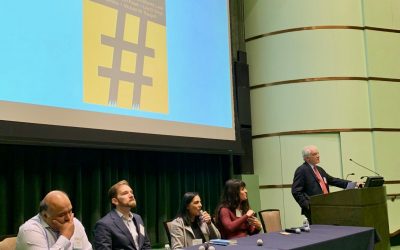
Political Communication Meets Big Data
Mike Traugott, Ceren Budak, Lisa O. Singh, and Jonathan Ladd presented findings from the S3MC Political Communications study at the Michigan Institute for Data Science (MIDAS) Seminar on November 14, 2019. The panel discussion, moderated by Rayid Ghani, covered...
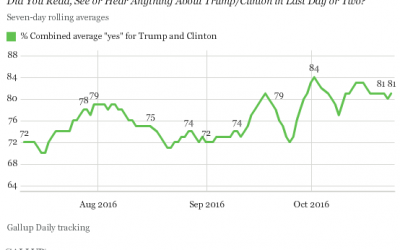
Americans Hear, Read and See More About Trump Than Clinton
Read more on Gallup's website.